The Diagnostics Tech has over 3.4K+ start-ups (globally) that comprise of companies providing products and services that enable physicians and consumers to detect presence of a disease or condition, segmented according to the technology used for diagnosis. This includes companies offering analytic algorithms, diagnostics devices, assays, kits and software. (Ref – Traxcn, 2021)
In fact, venture capital investment into health diagnostics companies peaked in 2020 with $4.8 billion going into the sector. (Ref – Chrunchbase, 2021). Diagnostic assays, pharmacogenomics, proteomics, liquid biopsy and molecular diagnostics are some of the top business models attracting major funding. (Ref – Traxcn, 2021)
Usually, a new technology enabled diagnostic product or service is commercialized using following steps: -
Assess viability for a commercialization
Establish Reliability (Accredited, Available, Quick and Accurate)
Launch and Penetrate Market
Encourage Early Adaption
Scale-Up for Dominant Market Share (optimize operational excellence)
Many innovative products and services by start-ups and also by established players are at different stages of commercialization. With changing technological landscape (5G, IoT, AI, Self-Diagnosis Products & Tools, Sophisticated Sensors are a few to name), such innovations are expected to consistently keep on growing for at least a decade.
In view of the above developments, a surge in healthcare diagnostics can be anticipated (within a short span of time –say five years in view). To accommodate this surge in number of diagnosed patients with different types of diseases, the eco-system of healthcare service provisioning must be suitably expanded without making any compromise with the aspirations of quality of healthcare service provisioning.
In this blogpost, an attempt to address the challenge to healthcare provisioning brought about by surge in diagnostics has been made (from healthcare sector policy makers and executives perspective). In this regards, the elaborations are summed-up in the following points: -
The P-DT Triangle – Let us review the P-DT triangle as shown in the figure below (Figure-1). It may be noted that at a stable healthcare eco-system, the diagnosis and treatment are optimized with respect to available resource (human and non-human for healthcare service provisioning) and accepted social norms of justified distribution of these resources amongst the population. Prevention of diseases by encouraging population to adapt preventive measures are considered as efforts to reduce the need for incremental-increase for healthcare services (diagnosis-treatment). However, at the same time good preventive practices also enhances quality of life (in general) and has synergic effects across different arena stretching from economic prosperity to social well-being to excellence in human development.
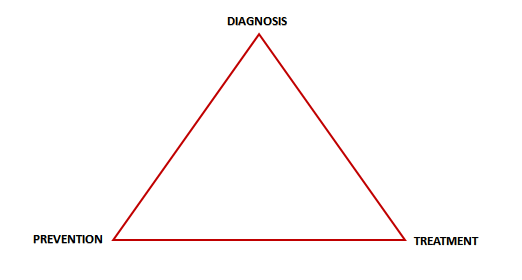
Figure – 1: The P-DT Triangle
The Prevention-Treatment and Treatment Diagnosis Curves – From the above discussion, it is evident that there is an inverse relationship between prevention and treatment. For simplicity let us consider the inverse relationship as linear having an assumed slope (Figure-2). Thus, where ever prevention is possible, higher efforts to do prevention may keep the requirements for treatment under check. And, it may be reasonable to assume that with adequate preventive measures the requirement for treatment may remain under control, even when the diagnosis increases rapidly to larger volumes (as increased diagnosis may result in increase in need for treatment only to accommodate a small population with undetected diseases, which have got infected despite prevention). The linear illustration of Treatment-Diagnosis Curve is shown in the following figure (Figure-3).
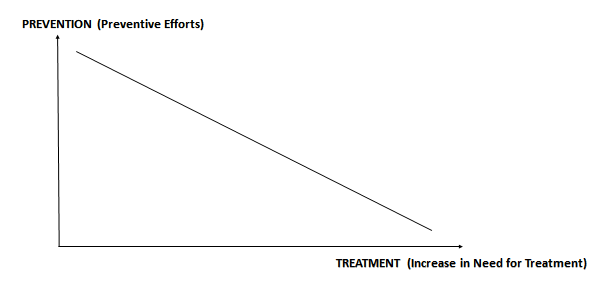
Figure – 2: The Prevention-Treatment Curve
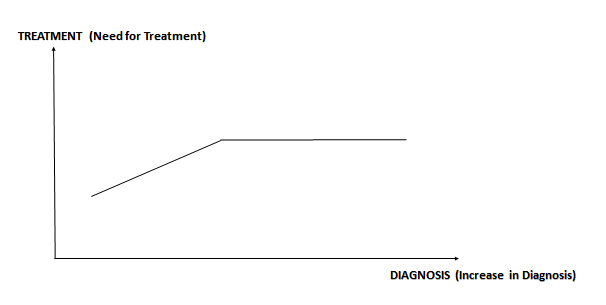
Figure – 3: The Treatment-Diagnosis Curve
The Prevention-Cure View of P-DT – In relation to the above discussions, it may also be pertinent to see the P-DT Triangle from Prevention-Cure perspective. This is shown in the figure below (Figure – 4). The Prevention is accomplished through Preventive Measures. Some of the preventive measures are as under: -
AWARENESS (general awareness, disease specific awareness)
HYGIENE (personal hygiene, social hygiene)
SELF-QUARUTINE (for communicable diseases)
SOCIAL DISTANCING (for communicable diseases)
HABBITS (smoking, alcohol consumption, … )
POVERTY ALLEVIATION (studies suggest link between poverty and diseases)
Similarly, cure measures may be summed up under following heads: -
DIAGNOSIS
CONVENTIONAL
DIGITAL (IoT, Sensors, Other Electronic Devices)
AI ENABLED
TREATMENT
OPD
IPD
REMOTE CONSULTATION
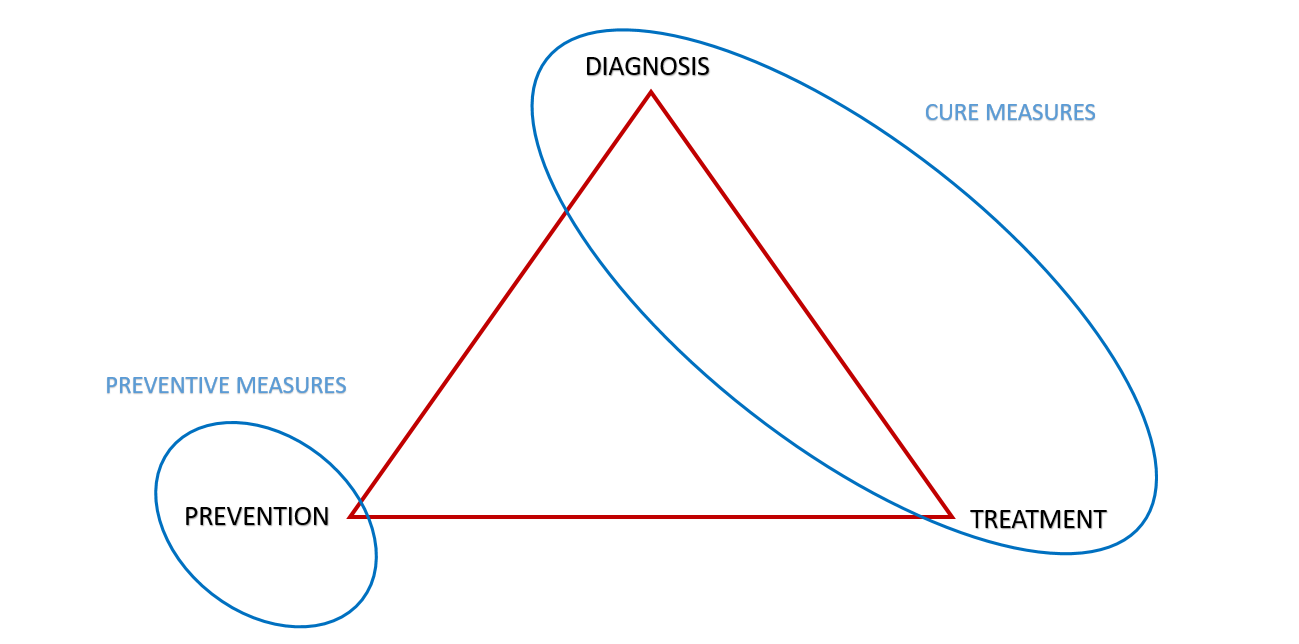
Figure – 4: The Prevention-Cure View of P-DT
The Diagnosis-Treatment Graph – While all the above points may be reasonably good approximation to understand a stable and broadly static ecosystem (going through predictable incremental changes in general and incremental increase in diagnostics in particular).
But, to address the expected case of rapid surge in diagnostics, we may need to do an analysis for a case where capacity of prevention and capacity of treatment remain largely static, while experiencing a surge in diagnostics. The following Diagnosis-Treatment graph is an attempt to illustrate this phenomenon (Figure – 5).
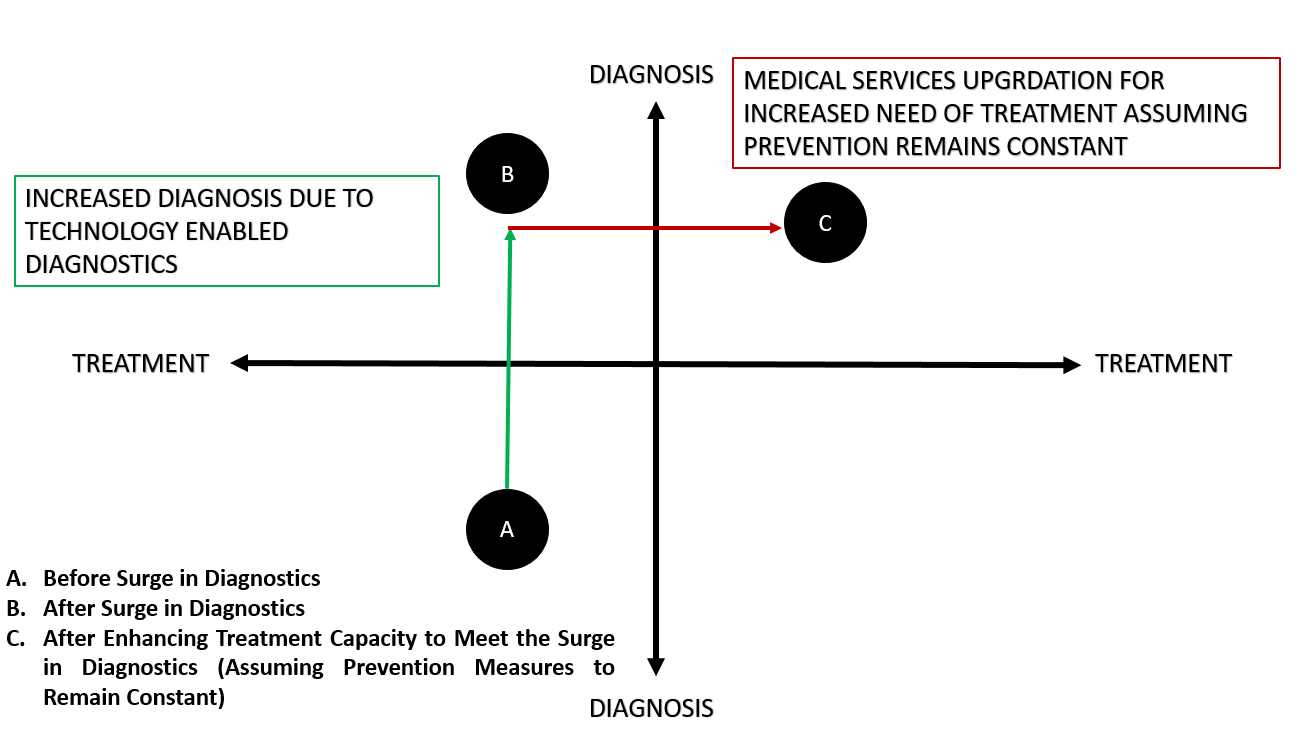
Figure – 5: The Treatment-Diagnostic Graph
It may be noted in the above figure that a low diagnostic and low treatment scenario represented by point A depicts a scenario of pre-diagnostic surge. Point B indicates a sudden increase in diagnostics with preventive measure failing to respond remaining ineffective. If there are prevalence of undetected diseases in population (may not be uncommon in larger part of the developing world), which needs treatment, then, at point-B, the healthcare services may appear collapsed. With limited resources to accomplish treatment, the judicious distribution of treatment services to needy may be difficult for officials officiating public health service delivery. Such scenarios may not only happen in the cases of technology enabled surge in diagnostics but also during pandemic-like situation or (say) during targeted medical surveillance (for identified localized outbreak). The challenge to take the treatment from B to C level immediately is difficult one. This is more aggressive than going from A to C following an evolutionary path gradually over a period of time.
The Prevention-Treatment Curve Revisited for a Surge in Diagnostics –
Let us assume that a particular disease is prevalent in significant population. Many of those population suffering from the disease do not have access to proper and timely treatment. The disease could be a communicable or non-communicable disease. This scenario is not uncommon in many developing countries.
Taking this imaginary example, let is refer to the following figure (Figure – 6). The observations are listed as under: -
There is an inverse relation between Prevention & Treatment. For illustration, a linear inverse relationship with an assumed value of slope is considered in Figure – 6 below.
Initial Prevention level is P1 (say) and Initial Treatment Capacity is T1 (say) and they follow (say) a simplistic linear relationship shown by the “Initial” line (with (T1,P1) as coordinate on the line with an assumed slope). Let us assume all other influencing parameters remaining unchanged while traversing Initial line on Prevention-Treatment plane.
A Surge in Diagnosis is observed (due to Technology Enabled Diagnosis getting accessible and adapted at grass root level).
Surge in Diagnosis leads to an increase in identification of patients (includes those patients, who may otherwise not have been diagnosed, if Technology Enabled Diagnosis may not have adapted).
Correspondingly, Treatment Capacity needs to increase (say from T1 to T2 in order to meet the increased demand in the light of diagnosis surge) and the Prevention level remains at P1. Assuming all other influencing factors remain unchanged, now in this changed scenario (where (T2, P1) should remain co-ordinate in relationship line representing Prevention-Treatment Plane with exactly same slope as “Initial”), the “Post Diagnostic Surge” line represents the relationship between Prevention-Treatment plane.
Expanding Treatment from T1 to T2 could be Costly and Time Consuming.
Therefore, in parallel with the adaption technology enabled diagnostics, simultaneous efforts on vigorous Prevention Drives could be initiated, which may result in increasing Prevention Level from P1 to P2.
Due to such an aggressive effort on Prevention Efforts, the occurrence of cases of disease may decrease and therefore at the same level of Surge in Diagnosis the observed patients needing treatment will be lesser than T2 (which will be T3, as it happens to be the point in the new reduced “Post Diagnostic Surge” dotted line corresponding to P2).
Thus, with on-going adaption of Technology Enabled Diagnostic, a parallel effort on Prevention may reduce requirements of Treatment capacity from value equal to T1 – T2 to value equal to T1 – T3 (causing reduction in treatment capacity by a difference between T2 and T3 (T2 – (minus) T3).

Figure – 6: The Prevention-Treatment Curve for Suddenly Increased Diagnosis for a Silently Prevalent Disease in the Population
The above mentioned discussions are an effort to list down some points for healthcare sector professionals to organize thoughts, strategize and plan for challenges faced due to adaption of technology enabled diagnostic products and services in time to come.
/********************/