Source - http://data.gov.in/catalog/state-wise-distribution-principal-characteristics-fourth-all-india-census-msme-registered#web_catalog_tabs_block_10
Detailed Report on MSME Census can be downloaded at: http://fisme.org.in/document/FinalReport010711.pdf
TABLE - 1: State-Wise Distribution Of Principal Characteristics (Fourth All India Census of MSME: Registered Sector, 2006-07) ordered by Number of Enterprises
Chhattisgarh ranks 15th in Number of MSME as per the Census of MSME: Registered Sectors
TABLE - 2: State-Wise Distribution Of Principal Characteristics (Fourth All India Census of MSME: Registered Sector, 2006-07) ordered by Number of Employment
Chhattisgarh ranks 19th in Number of Employment as per the Census of MSME: Registered Sectors
TABLE - 3: State-Wise Distribution Of Principal Characteristics (Fourth All India Census of MSME: Registered Sector, 2006-07) ordered by Ratio of Gross Output and Total Input
Author's Own Calculations Based On the Data from Census of MSME: Registered Sectors
Chhattisgarh ranks 30th in Ratio of Gross Output and Total Input as per the Census of MSME: Registered Sectors
In the above table Gross Output and Total Input are calculated during MSME Census as per following table:-
TABLE - 4: State-Wise Distribution Of Principal Characteristics (Fourth All India Census of MSME: Registered Sector, 2006-07) ordered by Exports
Chhattisgarh ranks 22nd in Exports as per the Census of MSME: Registered Sectors
TABLE - 5: State-Wise Distribution Of Principal Characteristics (Fourth All India Census of MSME: Registered Sector, 2006-07) ordered by Net Worth
Chhattisgarh ranks 19th in Net Worth as per the Census of MSME: Registered Sectors
Detailed Report on MSME Census can be downloaded at: http://fisme.org.in/document/FinalReport010711.pdf
TABLE - 1: State-Wise Distribution Of Principal Characteristics (Fourth All India Census of MSME: Registered Sector, 2006-07) ordered by Number of Enterprises
Chhattisgarh ranks 15th in Number of MSME as per the Census of MSME: Registered Sectors
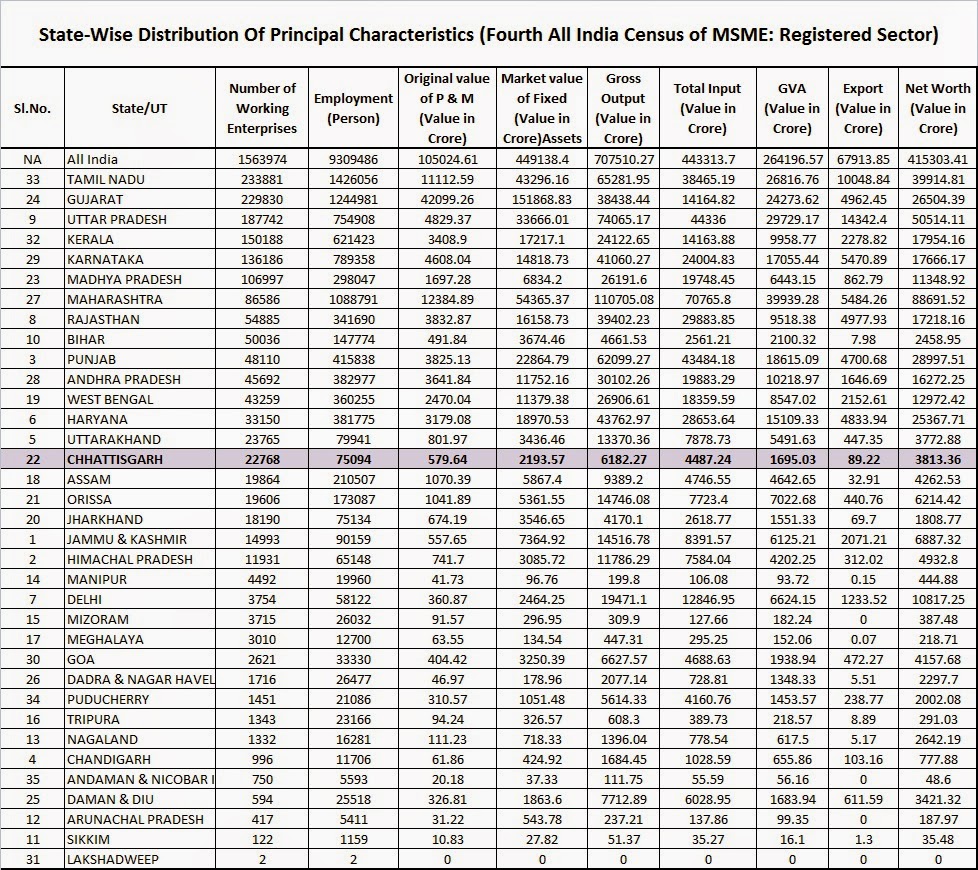 |
| State-Wise Distribution Of Principal Characteristics (Fourth All India Census of MSME: Registered Sector) ordered by Number of Enterprises |
TABLE - 2: State-Wise Distribution Of Principal Characteristics (Fourth All India Census of MSME: Registered Sector, 2006-07) ordered by Number of Employment
Chhattisgarh ranks 19th in Number of Employment as per the Census of MSME: Registered Sectors
 |
| State-Wise Distribution Of Principal Characteristics (Fourth All India Census of MSME: Registered Sector) ordered by Number of Employment |
TABLE - 3: State-Wise Distribution Of Principal Characteristics (Fourth All India Census of MSME: Registered Sector, 2006-07) ordered by Ratio of Gross Output and Total Input
Author's Own Calculations Based On the Data from Census of MSME: Registered Sectors
Chhattisgarh ranks 30th in Ratio of Gross Output and Total Input as per the Census of MSME: Registered Sectors
 |
| State-Wise Distribution Of Principal Characteristics (Fourth All India Census of MSME: Registered Sector) ordered by Ratio of Gross Output and Total Input (Author's Own Calculations Based On the Data from Census of MSME: Registered Sectors) |
In the above table Gross Output and Total Input are calculated during MSME Census as per following table:-
 |
| Calculation for Total Input and Gross Output Reference: http://fisme.org.in/document/FinalReport010711.pdf |
TABLE - 4: State-Wise Distribution Of Principal Characteristics (Fourth All India Census of MSME: Registered Sector, 2006-07) ordered by Exports
Chhattisgarh ranks 22nd in Exports as per the Census of MSME: Registered Sectors
 |
| State-Wise Distribution Of Principal Characteristics (Fourth All India Census of MSME: Registered Sector) ordered by Exports |
TABLE - 5: State-Wise Distribution Of Principal Characteristics (Fourth All India Census of MSME: Registered Sector, 2006-07) ordered by Net Worth
Chhattisgarh ranks 19th in Net Worth as per the Census of MSME: Registered Sectors
 |
| State-Wise Distribution Of Principal Characteristics (Fourth All India Census of MSME: Registered Sector) ordered by Net Worth |